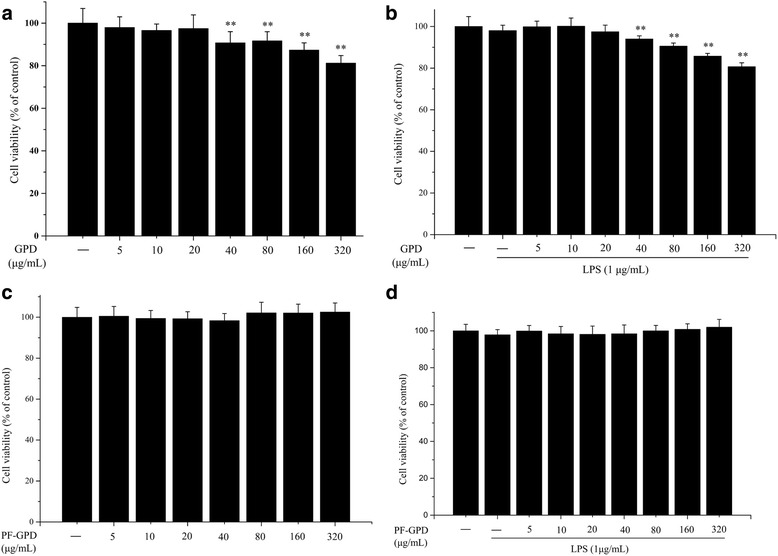
Fig. 2.

Effect of GPD and PF-GPD on the LPS-induced NO production in RAW 264.7 cells. Cells treated with indicated concentrations of GPD or PF-GPD were stimulated without or with 1 μg/mL of LPS for 24 h. The dexamethasone (DEX, 0.5 μg/mL) in 50 μL PBS were performed into positive control. The treated cell culture media were used to measure the amount of nitrite to evaluate NO production. ##P < 0.01 compared with untreated group; *P < 0.05, **P < 0.01 compared with the LPS group
