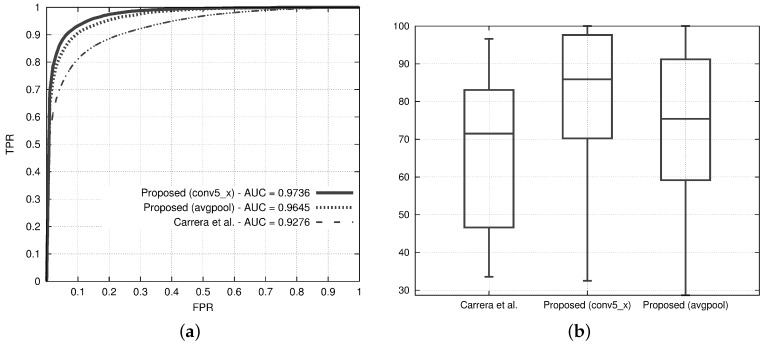
Figure 9.
Results from the two variants of the proposed method, one with conv5_x and the other with avgpool, and comparison with the method proposed by Carrera et al. [25]. Both the variants consider the PCA to reduce the feature vector, a patch size of 32 pixels and a dictionary of size 10. (a) Receiver Operating Characteristic (ROC) curves. For each ROC curve, the corresponding AUC values are in the legend; (b) box-plots reporting the distribution of the defect coverage obtained at a fixed False Positive Rate (FPR) = 5%.

