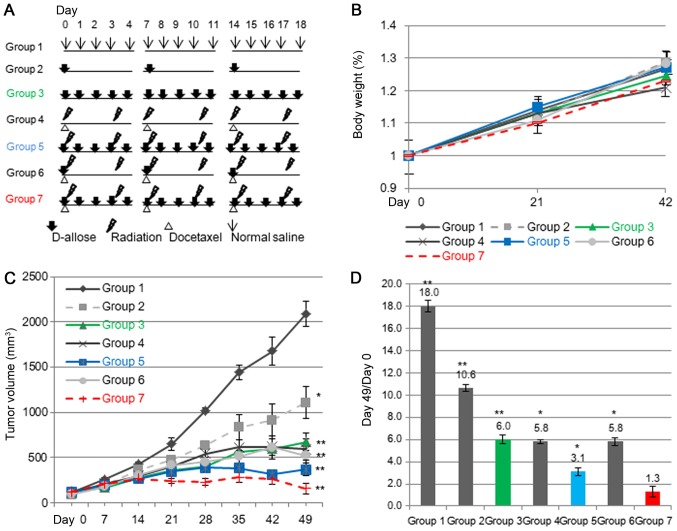
Figure 3.
Treatment scheme and effect of D-allose treatment in a xenofraft mouse model. (A) Treatment schedule; athymic nude mice were randomized to 7 different treatment groups. (B) Mice were weighed 6 weeks after the initiation of treatment. Effect of D-allose on tumor growth in vivo. (C) Tumor growth curves for the different treatment groups. Points, mean tumor volume; error bars, SE Statistically significant differences are indicated by asterisks: *P<0.01 vs. saline-treated mice. (D) The ratio of tumor volumes measured at day 0 and day 49. *P<0.05 and **P<0.01 vs. Group 1.

