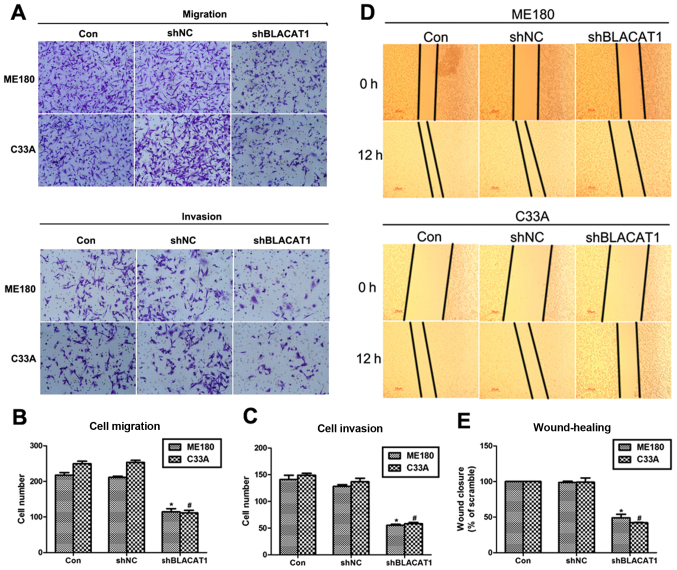
Figure 3.
Depletion of BLACAT1 suppressed cell metastasis in ME180 and C33A cells. (A) Representative images of Transwell assays were presented after treatment of shBLACAT1 on ME180 and C33A cells. (B) Quantification of cell migration assays showed the cell number on the lower surface of membrane upon shBLACAT1 transfection in ME180 and C33A cells. (C) Quantification of cell invasion assays showed the cell number on the lower surface of membrane upon shBLACAT1 transfection in ME180 and C33A cells. *P<0.05, vs. Con in ME180 cells. #P<0.05, vs. Con in C33A cells. (D) Representative images of wound-healing assays were presented after 0 or 12 h treatment of shBLACAT1 on ME180 and C33A cells. (E) Quantification of wound-healing assays showed the cell capacity to migrate and invade upon shBLACAT1 transfection in ME180 and C33A cells. *P<0.05, vs. Con in ME180 cells. #P<0.05, vs. Con in C33A cells.

