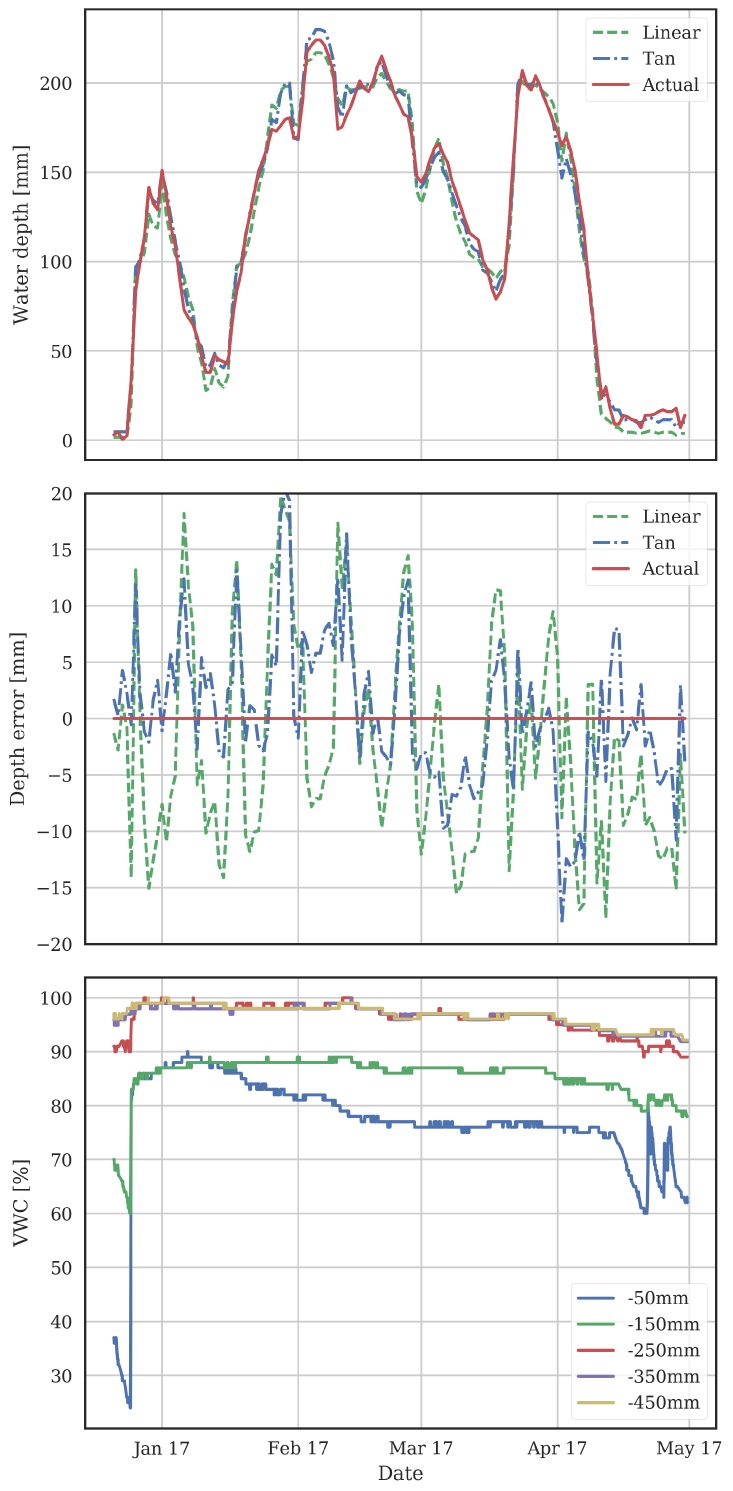
Figure 6.
Measurements from a rice field over a growing season. The top graph shows the water depth from the ultrasonic sensor and from the MCP probe using the linear and tangent models. The middle graph shows the difference between the ultrasonic depth and depths calculated from the MCP readings. The bottom graph shows the soil moisture.

