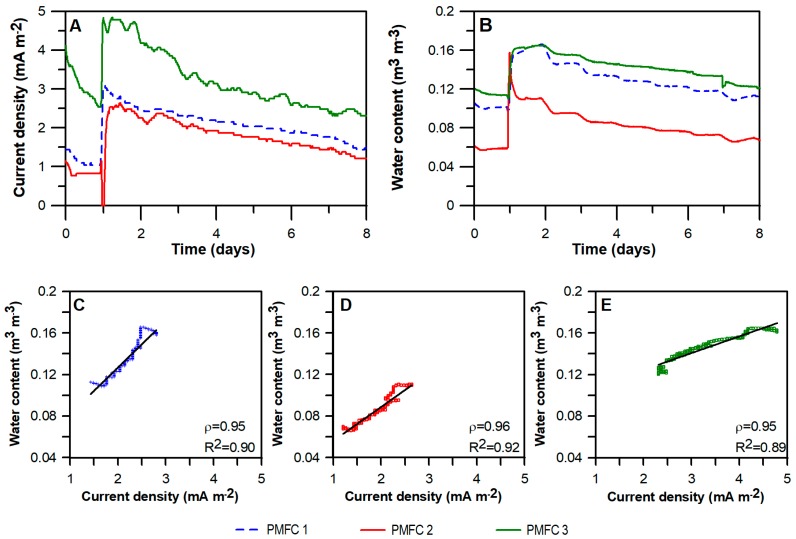
Figure 2.
Correlation between water content and current density produced by PMFC reactors in Laboratorio de Infraestructura Vegetal (LIVE). In the upper part: Current density (A) and water content in the substrate (B) of three PMFC reactors located in LIVE during eight days. An increase in both variables due to rainfall is shown. Lower part: Analysis of correlation between current density and water content for the dates showed in the upper part of the three reactors: PMFC 1 (C), PMFC 2 (D) and PMFC 3 (E).

