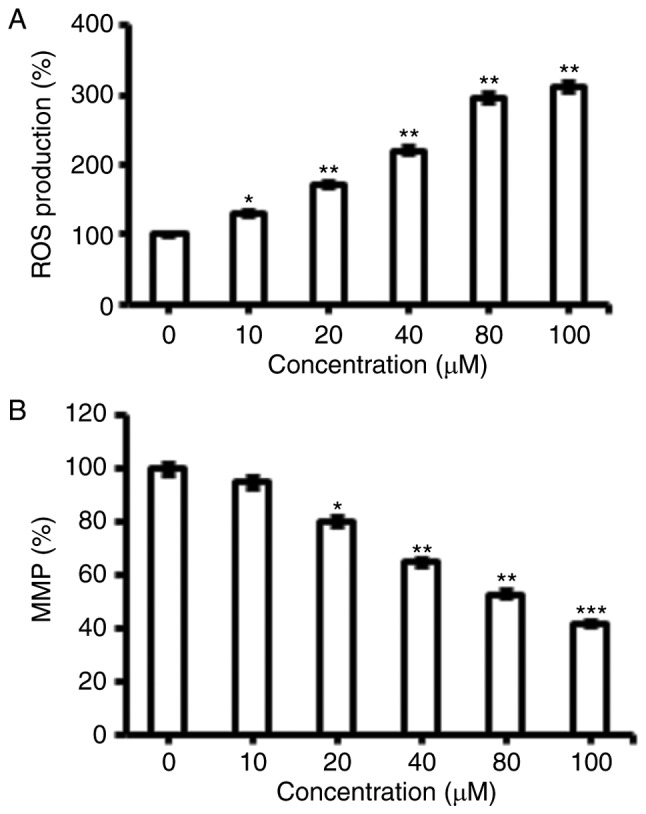
Figure 3.

Effect of indicated doses fucosterol on (A) ROS generation and (B) Mitochondrial membrane potential. Experiments were carried out in triplicates and expressed as mean ± SD and the values were considered significant at *P<0.01 vs. control, **P<0.001 vs. control, ***P<0.0001 vs. control.
