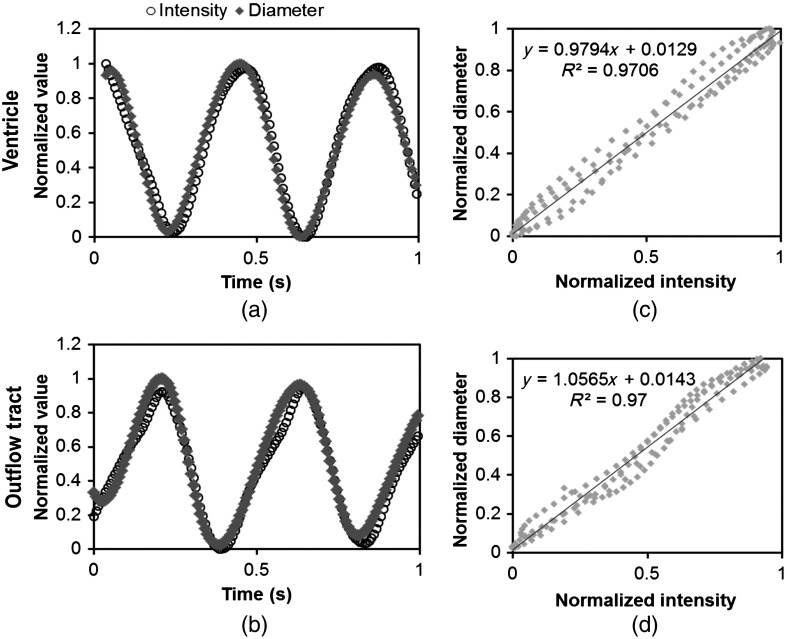
Fig. 2.
Comparison of centerline intensity and myocardial diameter over the cardiac cycle. Centerline intensity and myocardial diameters were obtained from the same M-mode images along lines in the (a) medial ventricle (V2) and (b) medial OFT (O2). (c, d) Correlation between normalized diameter and normalized intensity for the cases shown in (a) and (b), respectively. In (c) and (d), the line shows the idealized 1:1 correspondence.

