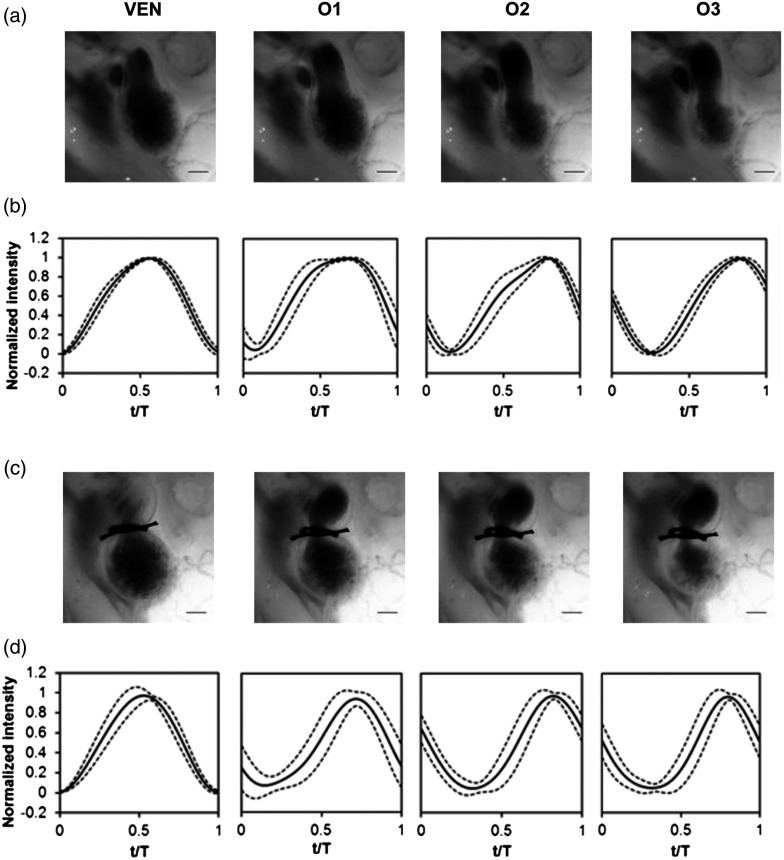
Fig. 6.
Aggregate cardiac intensity traces from sham and banded embryos. (a and c) Representative video frames of peak expansion in the ventricle at the V2 position (VEN) and each successive location in the OFT (O1, O2, O3). For a (a) sham control embryo; (c) banded (OTB) embryo. (b and d) Average traces (solid black lines) (dashed lines) for the ventricle (VEN) and each selected location in the OFT (O1, O2, O3). Averages were calculated across all embryos ( sham control embryos; banded embryos). For (b) sham control embryos and (d) banded embryos. . , time; , cardiac period; , normalized cardiac cycle.

