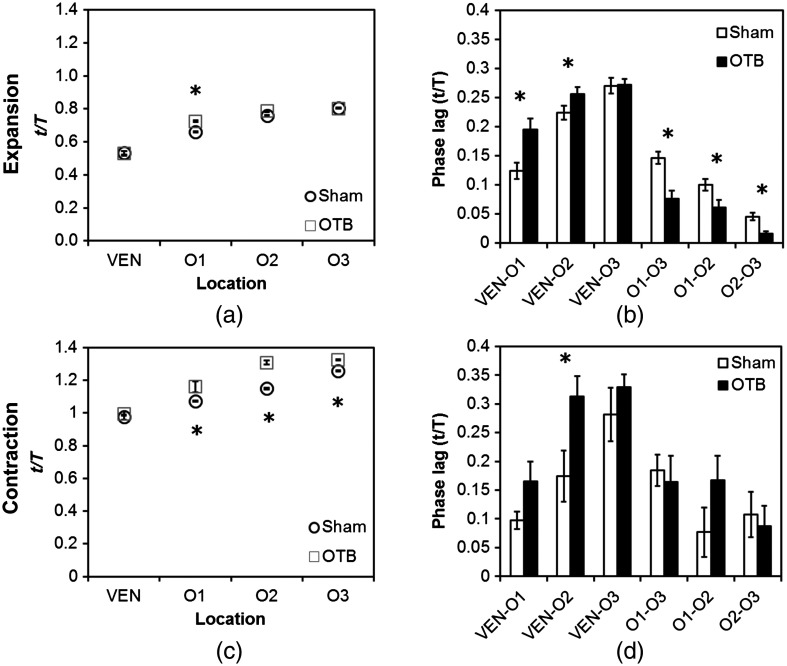
Fig. 7.
Comparison of the OFT and ventricle myocardial motion at maximum expansion and contraction in the sham control and banded HH18 embryo. Normalized time () to reach (a) maximum expansion (inverse-intensity) and (c) minimum inverse-intensity, corresponding to peak and minimum myocardial diameter, along the tubular HH18 heart Normalized time values greater than 1 in (c) indicate that peak contraction in the OFT occurs after peak contraction in the ventricle. Region-specific phase lags between points of (b) peak and (d) minimum inverse-intensity. Data are shown as mean ± SEM. -values obtained from Student’s -tests of less than 0.05 were considered statistically significant and are denoted by asterisks. , time; , cardiac period; , normalized cardiac cycle.

