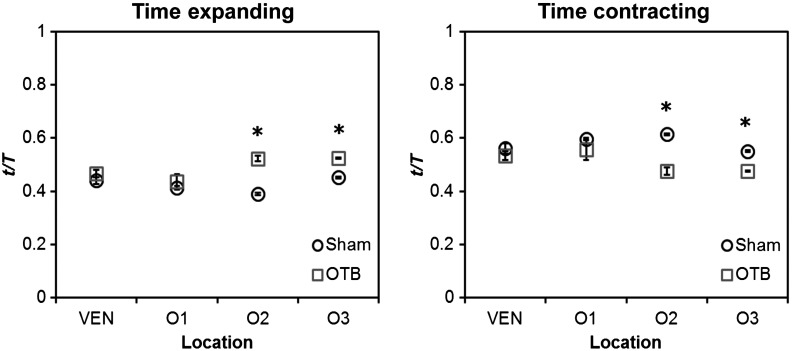
Fig. 8.
Portion of the cardiac cycle spent in (a) the contraction and (b) expansion phases in the sham control and banded developing heart. Time in contraction was calculated as the time difference between minimum intensity and following peak intensity and time in expansion was calculated as the time difference between peak intensity and following minimum intensity. Data are shown as ; -values obtained from Student’s -tests of less than 0.05 were considered statistically significant and are denoted by asterisks. , time; , cardiac period; , normalized cardiac cycle.

