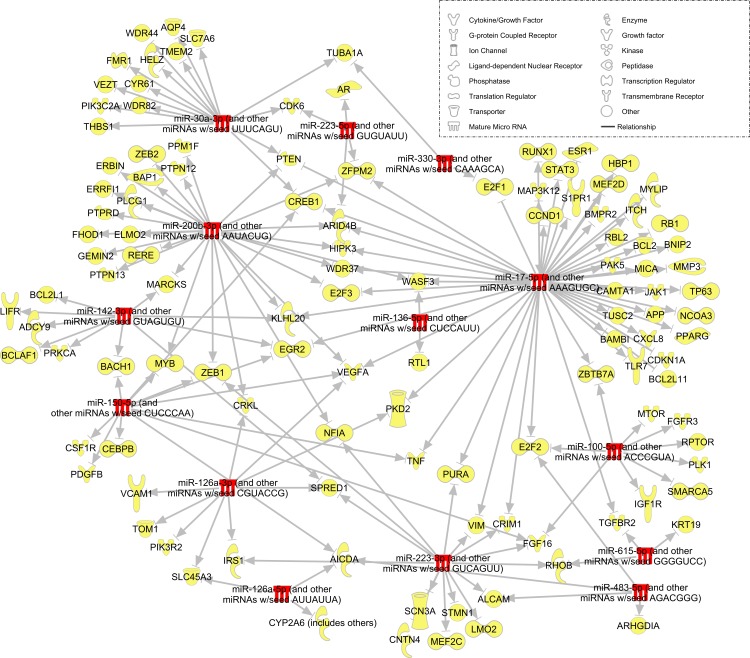
Figure 7.
miRNA targeting network. Schematic diagram displaying miRNA (red) upregulated in BMSC sEV and their experimentally observed mRNA targets (yellow). Targeted genes were identified with ingenuity pathway analysis software and filtered for experimentally observed interactions and, miRNA/mRNA sequences identified in both human and rat.

