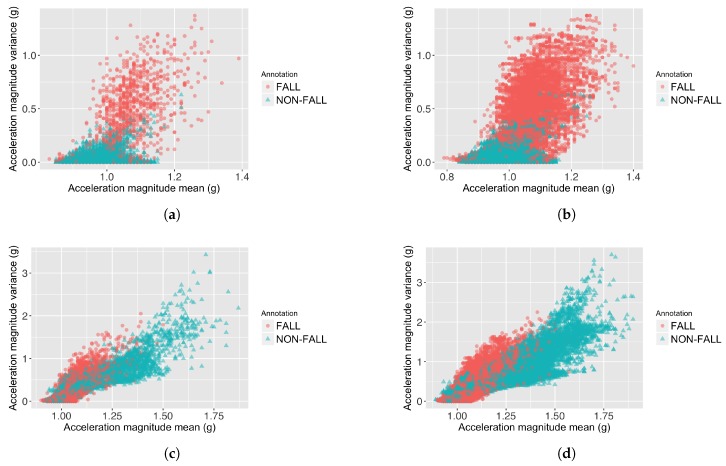
Figure 3.
Data overlaps caused by increasing the window overlap on FOSW. (a) Feature value distribution of 25%-FOSW on the Cogent dataset; (b) Feature value distribution of 90%-FOSW on the Cogent dataset; (c) Feature value distribution of 25%-FOSW on the SisFall dataset; (d) Feature value distribution of 90%-FOSW on the SisFall dataset.

