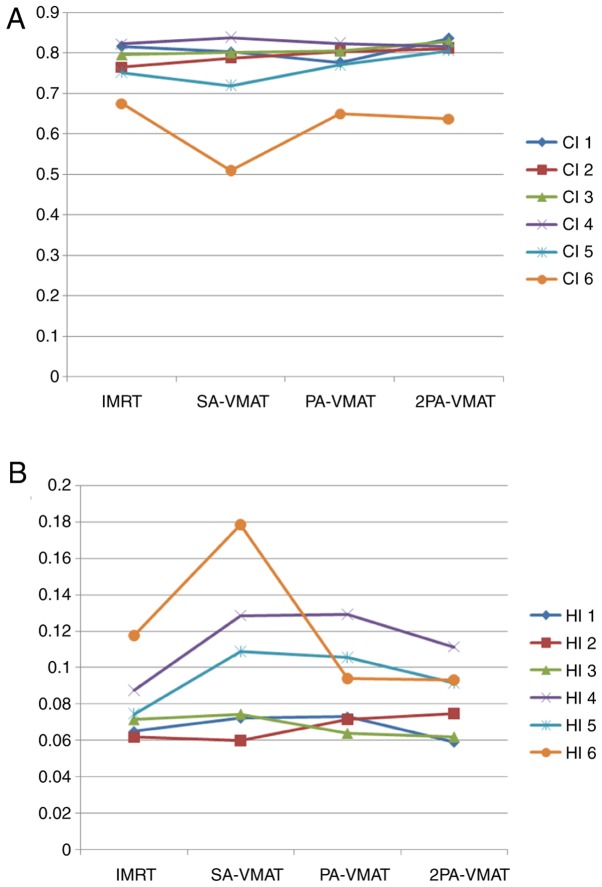
Figure 2.
Line charts display the comparison of (A) CI and (B) HI between VMAT and IMRT plans in 6 patients (indicated by different lines) with peripheral lung cancer. The horizontal axis represents the four different plans. The vertical axis represents values of CI and HI. CI, conformity index; HI, homogeneity index; VMAT, volumetric modulated arc therapy; IMRT, intensity-modulated radiation therapy; PA, partial arc; SA, single arc; 2PA, double partial arc.

