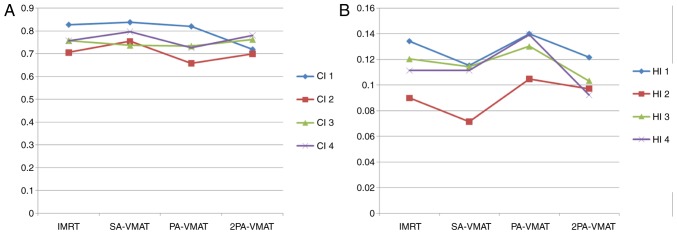
Figure 5.
Line charts display the comparison of (A) CI and (B) HI between VMAT and IMRT plans in 4 patients with central lung cancer in which the target volume encompasses the mediastinal lymphatic drainage region. The horizontal axis represents the four different plans. The vertical axis represents values of CI and HI. CI, conformity index; HI, homogeneity index; VMAT, volumetric modulated arc therapy; IMRT, intensity-modulated radiation therapy; PA, partial arc; SA, single arc; 2PA, double partial arc.

