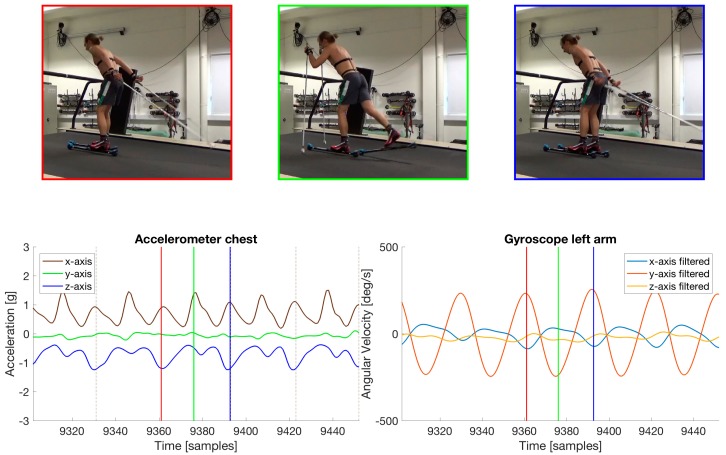
Figure 2.
The cycle detection is done by filtering the gyroscope data from one of the arms. The y-axis results in a signal with a clear sinusoidal shape. By synchronizing this signal to a video of the skier we can observe that the peaks in the signal correspond to when the arm is extended all the way behind the athlete. This is indicated with the red and blue vertical lines in the plots. The red and blue vertical lines correspond to the video-frame displayed above with the corresponding color. The minima of the sinusoid on the y-axis corresponds to when the arms plant the poles in front of the skier, as illustrated by the green vertical line and film frame.

