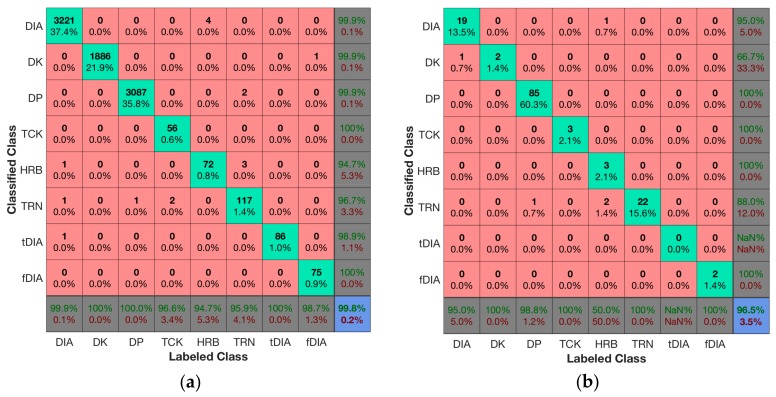
Figure 4.
Confusion matrices for the training data (a) and validation data (b) showing that the overall accuracy for the training data (a) was 99.8%, although it dropped to 96.5% for the validation dataset. The accuracy can be read from the lower right element of the matrix, while the bottom row reports the sensitivity for each class, and the right most column reports the precision. The diagonal shows the true positive values for each class (labeled and classified as that class), while the numbers off the diagonal report any confusion between the classes.

