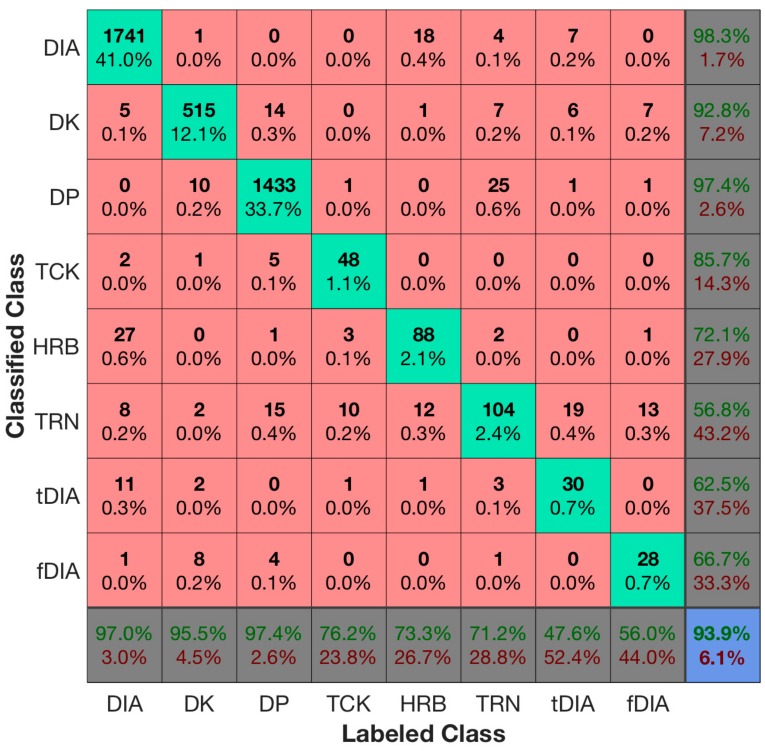
Figure 5.
A combined confusion matrix for the all the test datasets. We can, for example, observe that the overall accuracy was 93.9% (lower right value), DP had the best sensitivity (lower row) of 97.4% and DIA had the best precision (rightmost column) of 98.3%. Also, fDIA had the worst sensitivity of 47.6%, and TRN had the worst precision of 56.8%.

