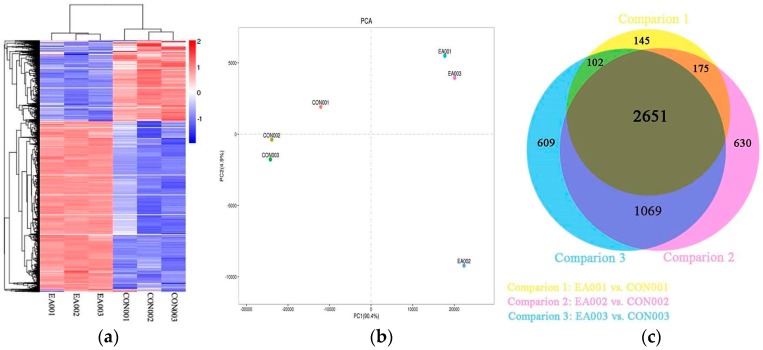
Figure 2.
Overview of differentially expressed genes (DEGs). (a) Hierarchical clustering; (b) Principal component analysis; (c) An Venn diagram of DEGs. CON001, CON002 and CON003 were control groups. EA001, EA002 and EA003 were EA groups. Samples from same numbers were twin goats’ the periaqueductal gray.

