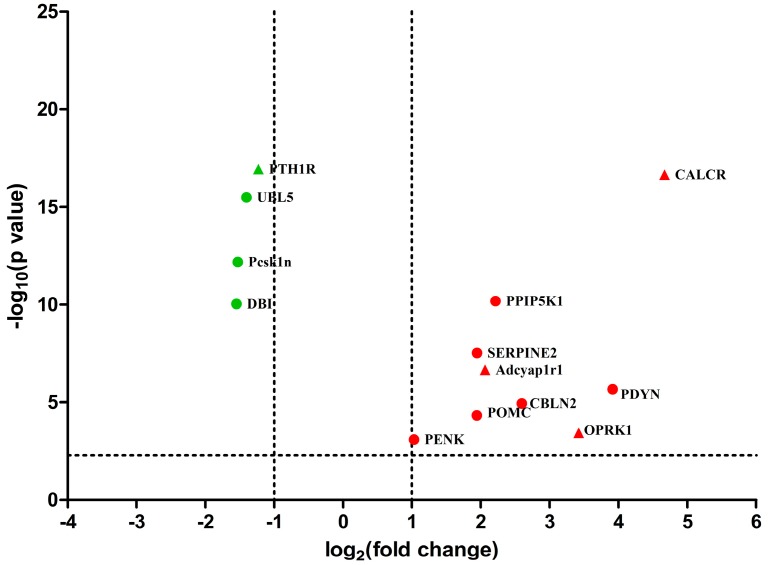
Figure 3.
Volcano plot displaying differential expressed neuropeptide and neuropeptide receptor genes between EA and the control group. The y-axis corresponds to the value of log10 (p value), and the x-axis displays the log2 (fold change). The red dots represent the up-regulated neuropeptides genes (p < 0.005). The green dots represent the down-regulated neuropeptides genes (p < 0.005). The red triangles represent the up-regulated neuropeptide receptor genes (p < 0.005). The green triangles represent the down-regulated neuropeptide receptor genes (p < 0.005).

