Figure 7.
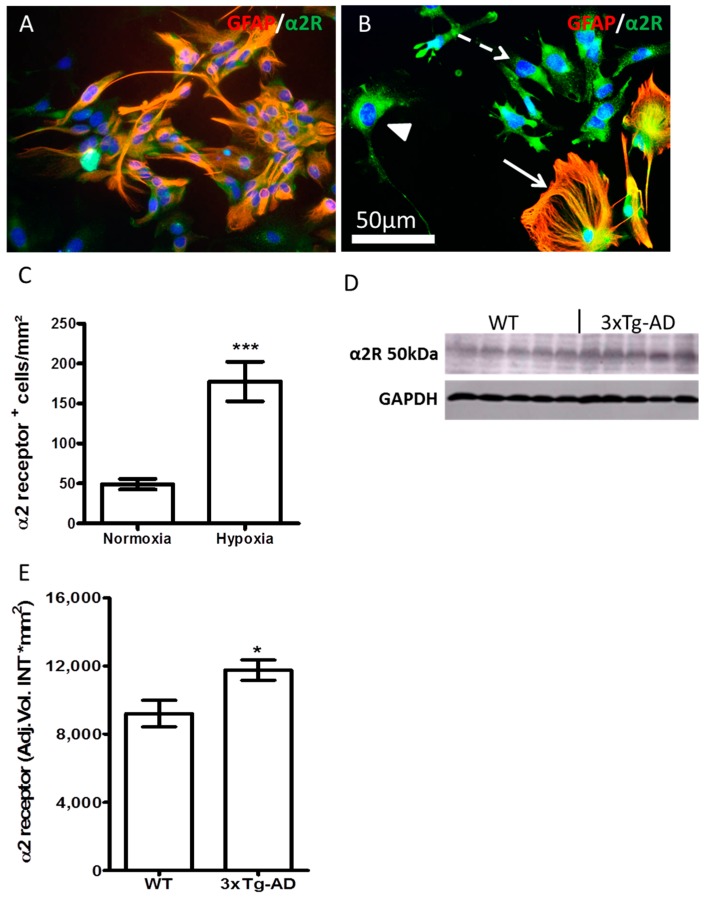
Increased expression of α2 receptor upon hypoxia and AD-like culture condition. (A) APC (DIV7) from the brains of new born C57BL/6 stained for GFAP (red) and α2 receptor (green); (B) Increased α2 receptor (green) in GFAP+ (red) astroglia (arrow), neurons (arrowhead), and fibroblast-like progenitors (dashed arrow) upon hypoxia; (C) Quantification of α2 receptor-positive cells in DIV7 APC from the brains of C57BL/6 newborn mice. (D) Western blot analysis of α2 receptor (α2R) from the brain homogenates of 14-month-old 3×Tg-AD and wild type (WT) C57/BL6 mice. (E) Densitometric analysis of (D). Data are presented as mean ± SEM (n = 5) and analyzed by Student’s t-test. * p < 0.05; *** p < 0.001. Scale bar in (B) is 50 µm.

