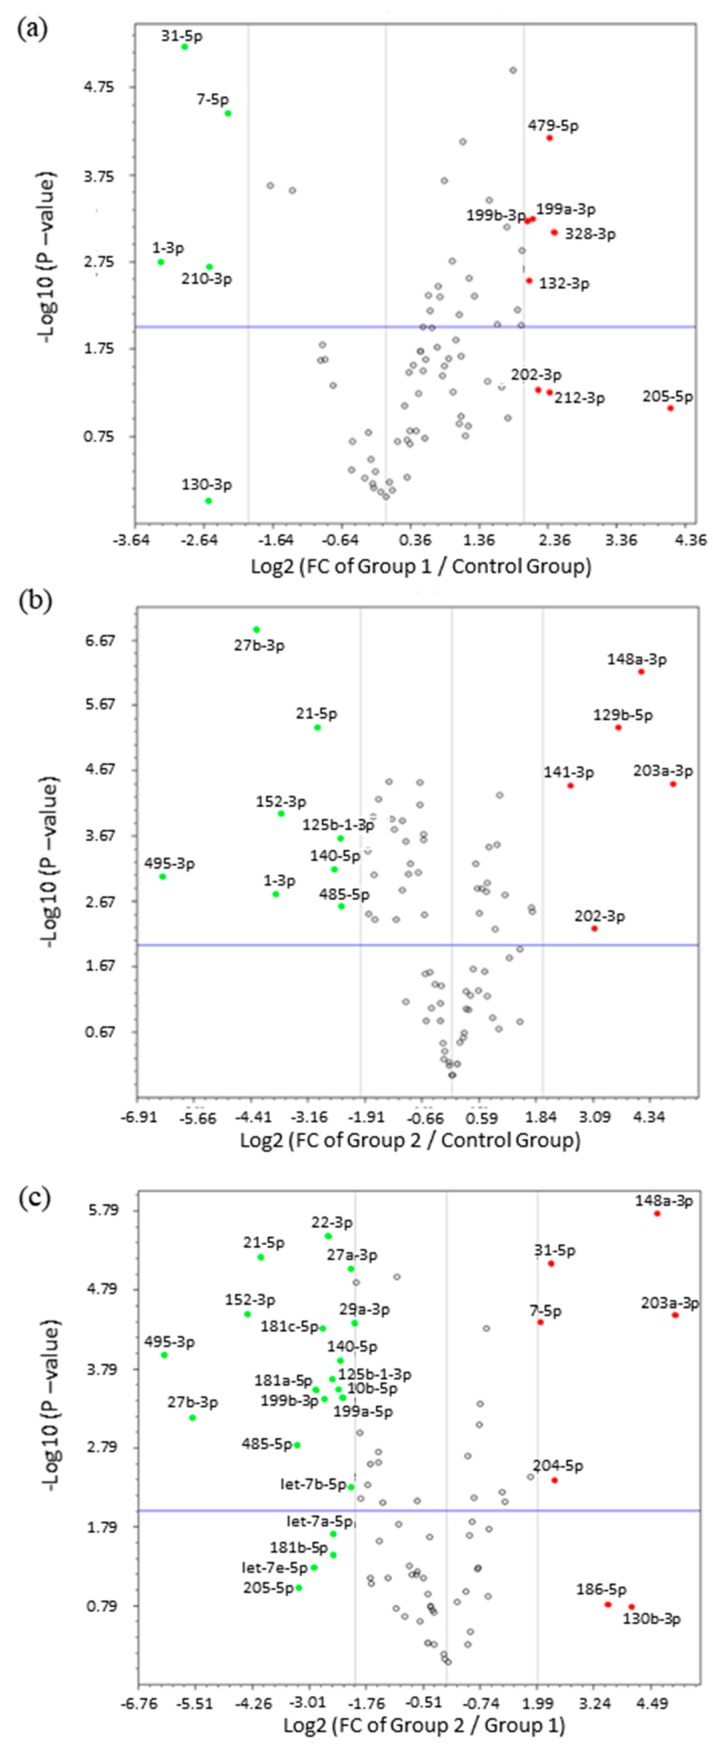
Figure 3.
Volcano plots with differentiated expression of miRNAs. (a) miRNAs expression in ULM (group 1) compared with MM (control group); (b) miRNA expression in ULMS (group 2) compared with MM; (c) miRNAs expression in ULMS compared with ULM. FC expression cut-off values of +4 and −4. In green, down-regulated miRNAs and, in red, up-regulated miRNAs.

