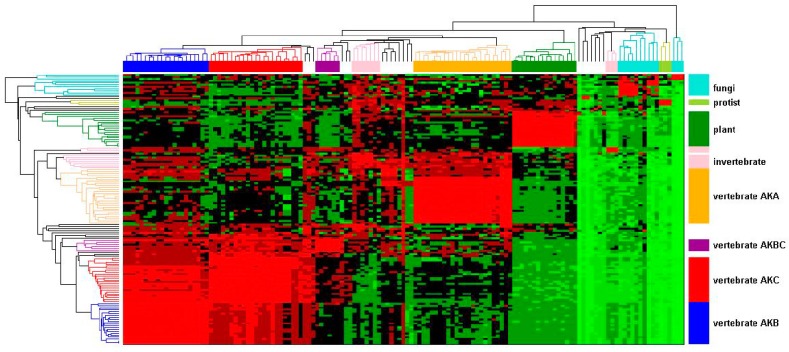
Figure 1.
Evolutionary relationships in the AK gene family. An AK gene family hierarchical cluster was constructed based on percent identity. Each AK protein sequence was chosen in turn as query sequence in Blastp searches. The resultant pair-wise percent identities were plotted. The identity is indicated by color, ranging from the highest to lowest identity, progressively colored light red, red, maroon, black, dark green, medium green, and light green. The AK isoform designation refers to the vertebrate isoforms; other designations refers to the relevant species groups: invertebrates, protist, fungi, or plant.

