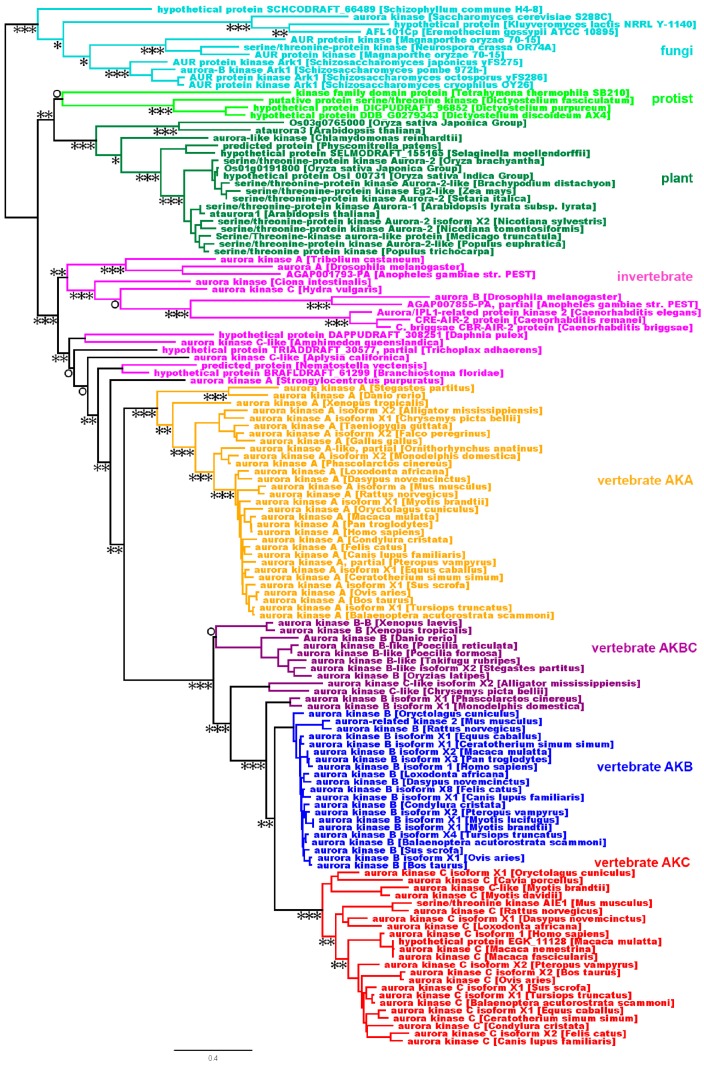
Figure 2.
The evolution of the AK gene family. An AK phylogenetic tree was built using FatTree 2. Horizontal lines are proportional to the substitution rate. The bar represents 0.3 changes per amino acid. Local support values are marked with ***, **, * and ○ for 0.9–1.0, 0.7–0.89, 0.5–0.69 and <0.5, respectively.

