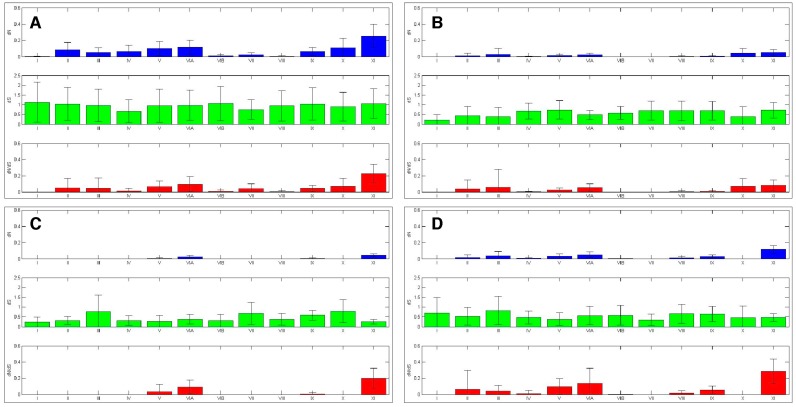
Figure 6.
AK kinase subdomains experienced differential selection. The selection experienced by the AK subdomains was calculated. The bars represent average value, while the error bars represent plus or minus one standard deviation for dN (top), dS (middle), and dN/dS (bottom), this analysis was carried out with (A) the entire AK gene family, (B) AKA, (C) AKB and (D) AKC.

