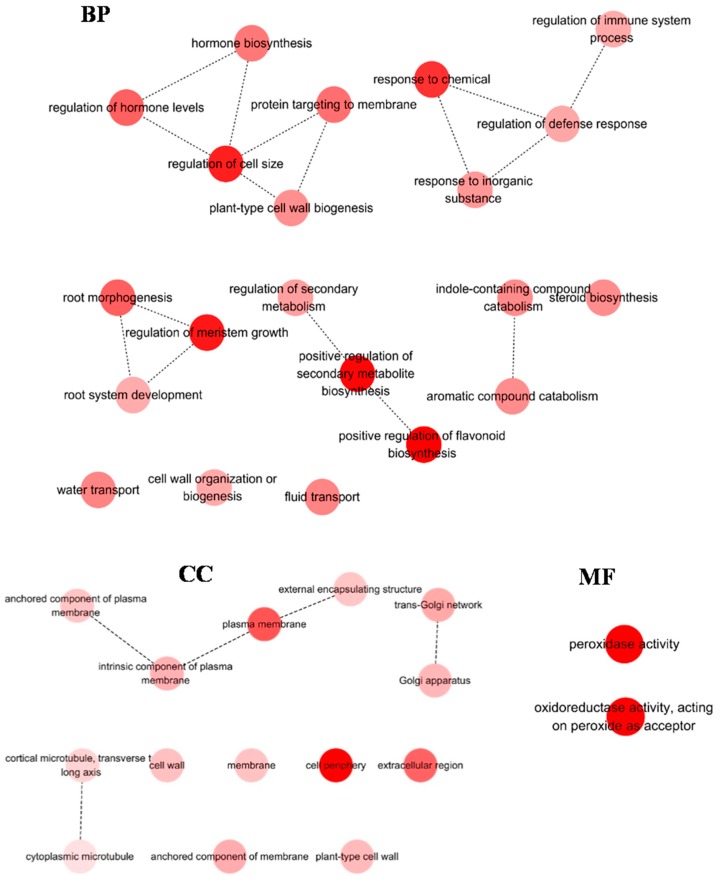
Figure 5.
GO terms enrichment analysis of DEGs (24 h) in root. Few GO terms were over-represented in R6 libraries. Therefore, only GO terms enrichment in R24 libraries were displayed. The genes were assigned to three main categories: biological process (BP), molecular function (MF) and cellular component (CC). Node filled color represented p value. White nodes were not significantly over-represented terms.

