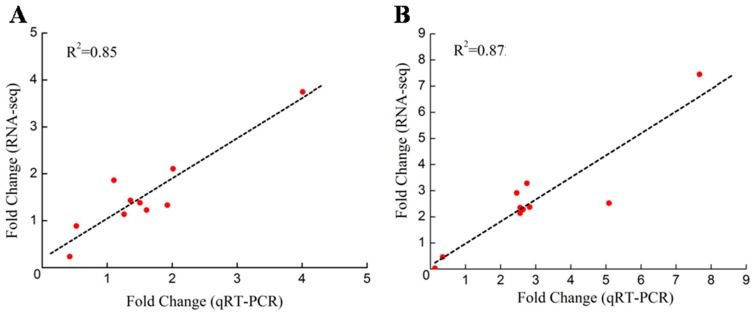
Figure 6.
Confirmation of the expression profiles of ten randomly selected unigenes by qRT-PCR. (A) A linear regression analysis of the fold-change (6 h vs. 0 h) between the DGE and the qRT-PCR; (B) a linear regression analysis of the fold-change (24 h vs. 0 h) between the DGE and the qRT-PCR. Total RNA was extracted from three replicated samples individually for each treatment of shoots and roots (n = 3).

