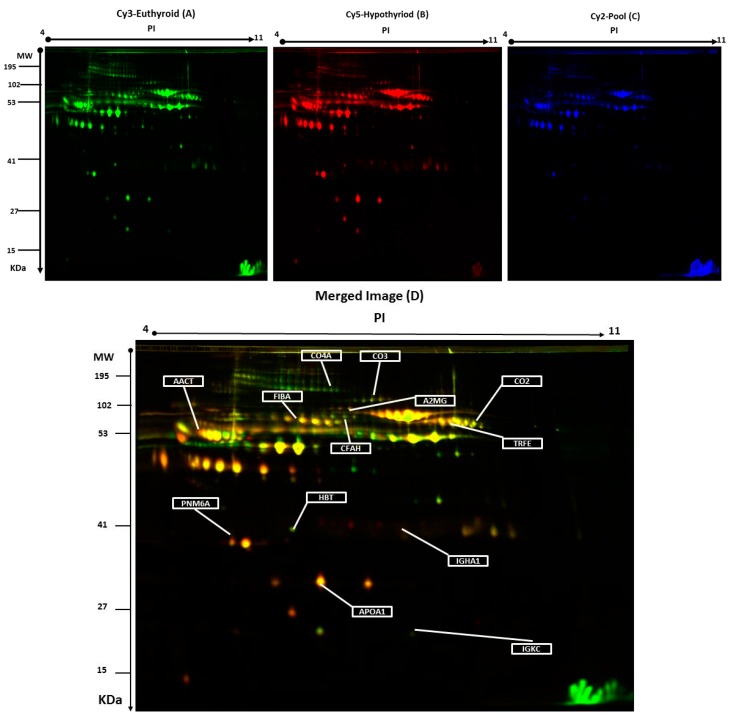
Figure 1.
Representative two-dimensional difference in gel electrophoresis (2D-DIGE) images of the plasma proteins. Protein samples from hypothyroid and euthyroid groups were labeled with Cy3 or Cy5, shown together with a pooled internal standard sample labeled with Cy2, and separated by 2D-DIGE. Gels were scanned and a set of images: (A) Cy3 (B) Cy5 and (C) Cy2 were obtained from each gel. An overlay of all three images (D). The arrows indicate differentially regulated protein spots that were determined by image analysis and identified by MALDI-MS.

