Figure 3.
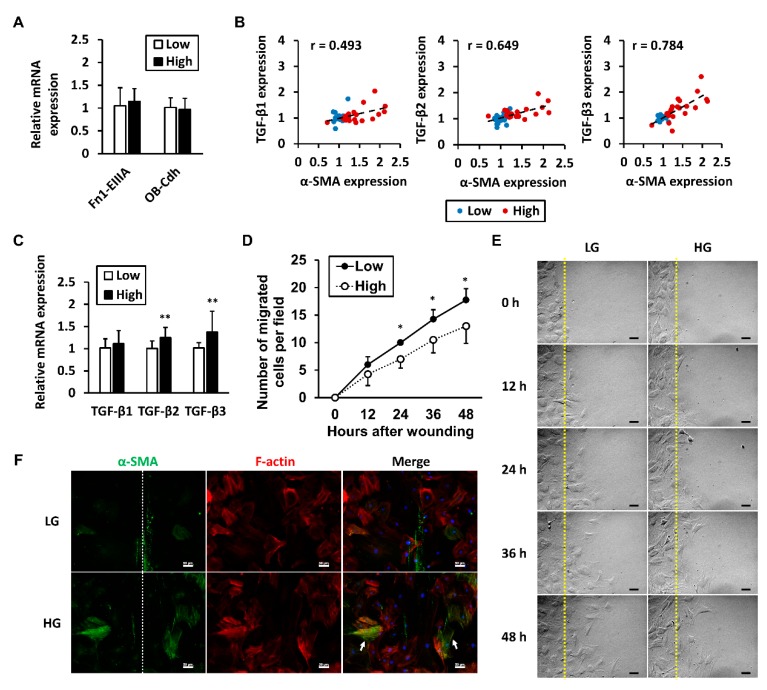
High glucose-induced increases in α-SMA expression do not indicate myofibroblastic differentiation. Tenocytes were cultured in high-glucose (HG) or low-glucose (LG) conditions for 1 week. (A) mRNA expression levels of the myofibroblast markers Fn1-EIIIA and OB-cdh were measured. Data are presented as the mean ± SD (n = 6); (B) Pearson’s correlation coefficients between mRNA levels of TGF-βs and α-SMA were calculated. Cell samples of both low- and high-glucose groups from four independent experiments (total n = 42) were included; (C) The mean ± SD of TGF-β mRNA levels in pooled samples are shown by group; (D) Cell migration rate is presented as the number of tenocytes that migrated into the wound at each time point (n = 3). Images of migrating cells are shown in (E), where the yellow dotted lines represent the outline of wounds; (F) F-actin and α-SMA (smooth muscle actin) were fluorescently labeled after wound closure, where white dotted lines represent the midline of wounds. No α-SMA-positive tenocytes migrated to the midline (arrows). Statistical significance is shown as * p < 0.05 or ** p < 0.01 compared to the low-glucose control group. Scale bar = 50 μm.

