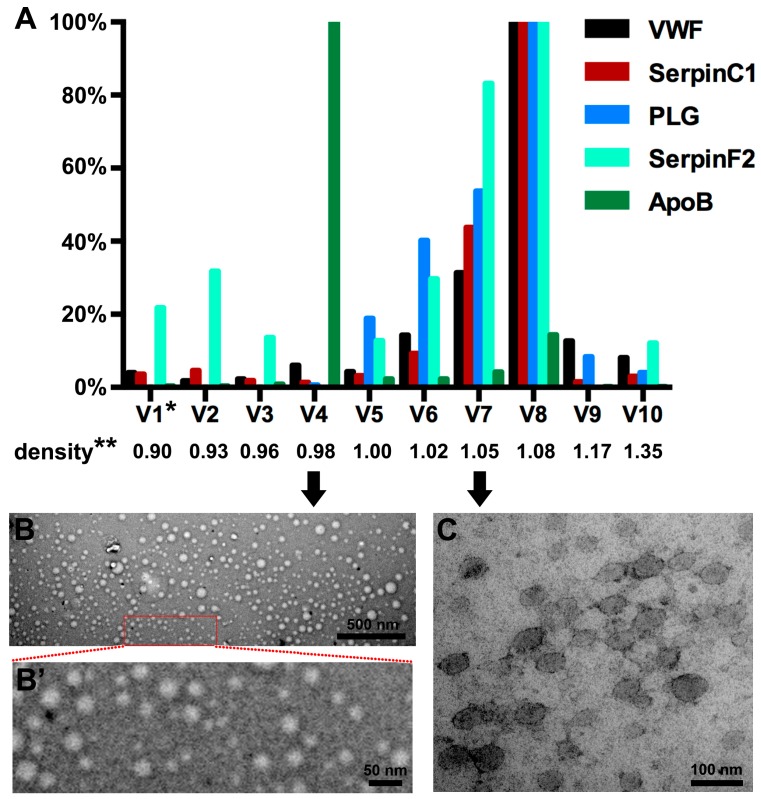
Figure 3.
Distribution of VWF, SerpinC1, PLG, SerpinF2, and ApoB in density sub-fractions of the (V)LDL precipitate after density gradient centrifugation. * V1, the first sub-fraction of (V)LDL precipitate. The density of each sub-fraction was indicated accordingly. ** The unit of density is g/mL. (A) Protein levels of VWF, SerpinC1, PLG, and SerpinF2 are presented as the percentage of the 8th sub-fraction (V8). Protein levels of ApoB are presented as the percentage of the 4th sub-fraction (V4). (B) A representative electron microscope (EM) image of the 4th sub-fraction shows lipoprotein particles. Scale bar = 500 nm. (B’) Larger magnification of insert in (B). Scale bar = 50 nm. (C) A representative EM image of the 7th sub-fraction shows EVs. Scale bar = 100 nm.

