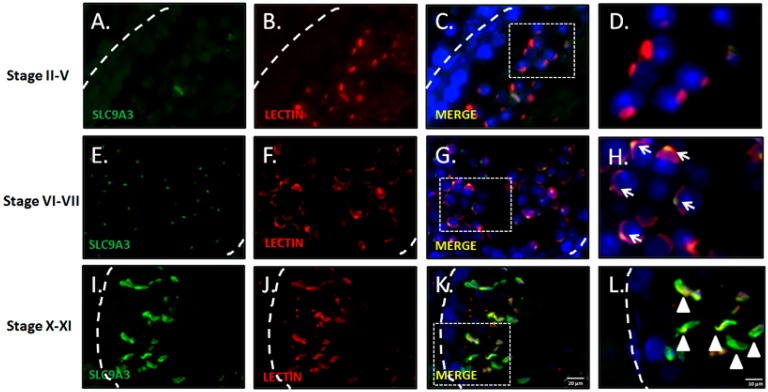
Figure 2.
Expression patterns and localization of SLC9A3 during murine spermatogenesis. Top to bottom: Stages II–V (A–D); stages VI–VII (E–H); and stages X–XI (I–L) of spermatogenesis; (A,E,I) show the SLC9A3 signal (green); (B,F,J) show Lectin (red; acrosome marker); (C,G,K) merge from (A,B,E,F,I,J), respectively. The nucleus was stained using DAPI (blue). The enlarged Figure of (C,G,K) are shown in Figures (D,H,L), respectively. Arrows indicate the acrosomal vesicles. Arrowheads indicate the acrosome-covered regions of sperm heads. The scale bar is 20 μm in (K), and 10 μm in (L).

