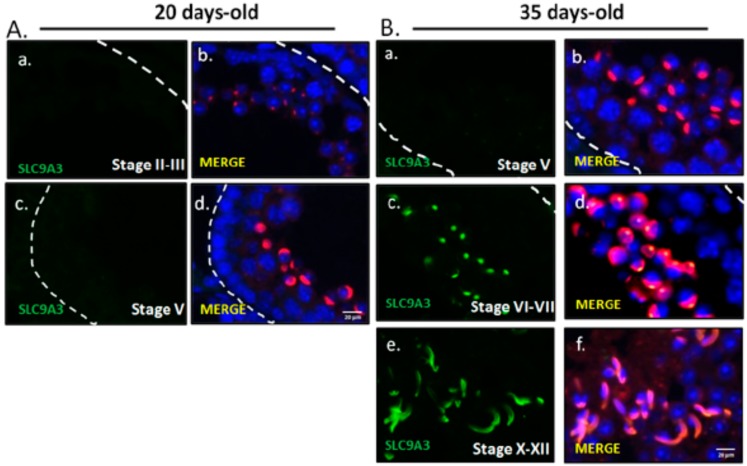
Figure 3.
SLC9A3 starts to be expressed in 35 postnatal-day-old testes (A) Testicular sections prepared from 20-day-old mice. From top to bottom stages II–III (a,b) and stages V (c,d); (B) Testicular sections prepared from 35-day-old mice. From top to bottom: stages V (a,b), stages VI–VII (c,d), and stages X–XII (e,f). (A(a,c)) and (B(a,c,e)) indicated SLC9A3 signal (green). (A(b,d)) and (B(b,d,f)) indicated the merged figure with SLC9A3 signals (green), Lectin signals (red), and DAPI (blue). The scale bar is 20 μm in (A(d)) and (B(f)).

