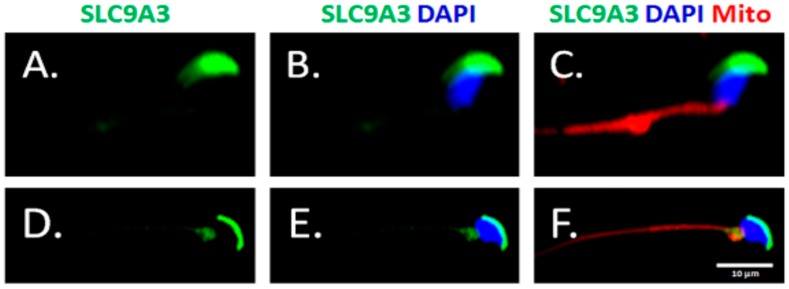
Figure 4.
Expression patterns of SLC9A3 in elongating and elongated spermatids. Immunofluorescence detection of SLC9A3 in elongating spermatids (A–C) and elongated spermatids (D–F). (A,D) show SLC9A3 signals (green); (B,E) show SLC9A3 signals (green) and nucleus signals (blue); (C) is merged from (A,B), and MitoTracker signals (Mito; red); (F) is merged from (D,E), and MitoTracker signals (Mito; red). Scale bar = 10 μm.

