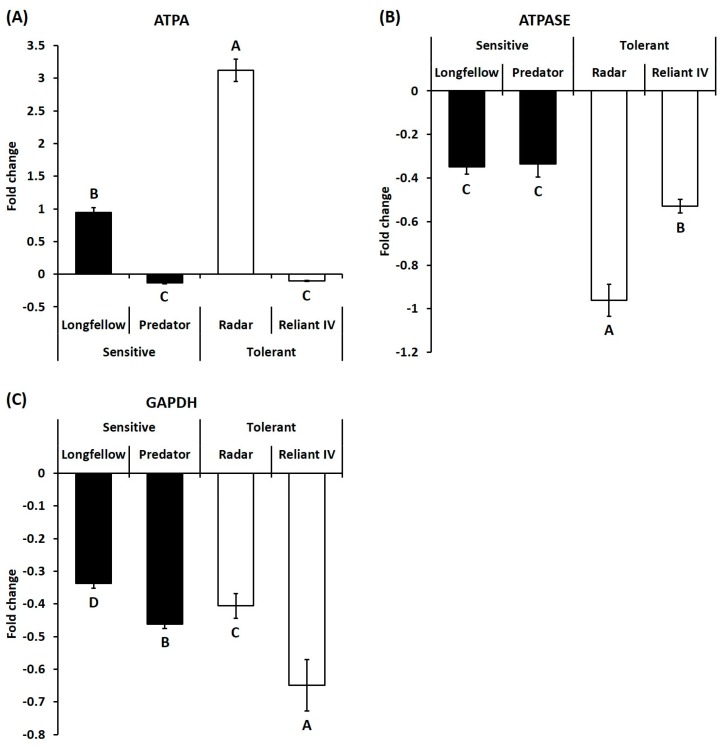
Figure 6.
Relative expressions of genes related to energy production at 35 days of heat stress, represented by fold change of transcript level under heat stress compared with that under control condition. Bar on each column represents standard error of four biological replicates (n = 4). Different letters indicate significant differences at the p level of 0.05. (A) ATPA: ATP synthase alpha subunit; (B) ATPASE: ATPase; (C) GAPDH: Glyceraldehyde 3-phosphate dehydrogenase.

