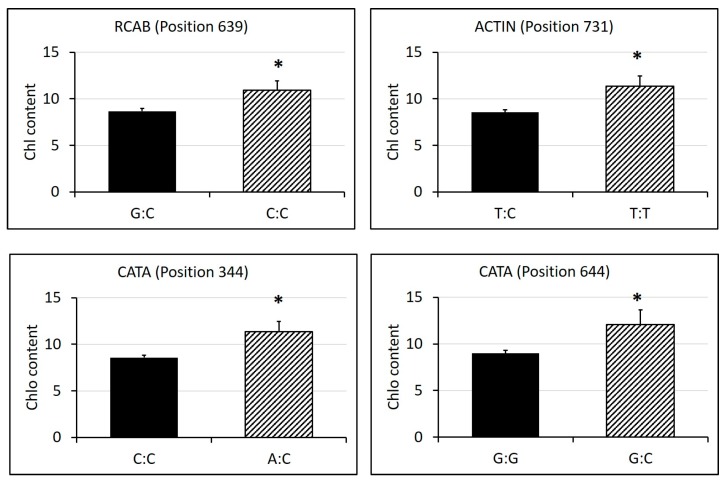
Figure 9.
SNPs in candidate genes that showed differential leaf chlorophyll (Chl) content levels between homozygous and heterozygous alleles under 35 days of heat stress. SNP genotypes and corresponding numbers of cultivars are labelled in the x-axis. Bars represent standard errors of each corresponding numbers of biological replicates (cultivars), and asterisks represent significant differences at p level of 0.05.

