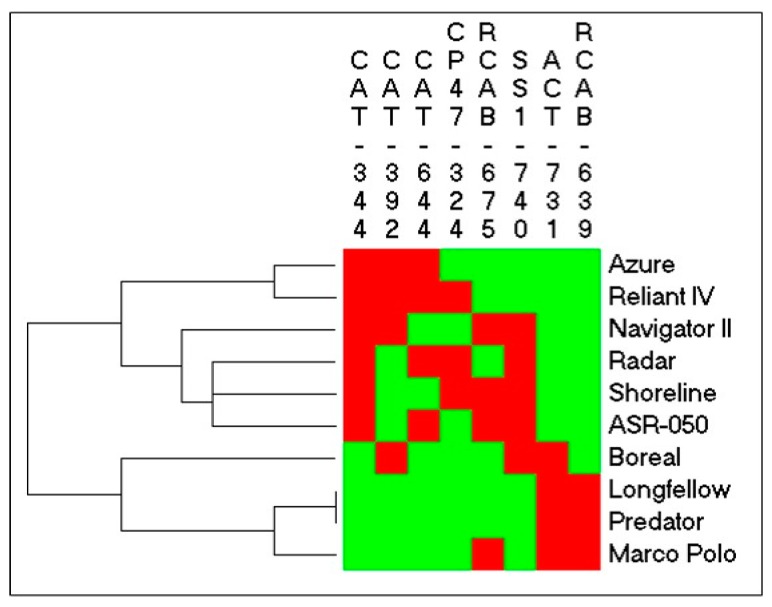
Figure 12.
Two-way clustering analysis of SNPs in fine fescue cultivars. Green and red indicate a homozygous and heterozygous allele in each SNP position, respectively. The column name is the candidate gene and SNP position, and the row name is the cultivar. The Pearson’s R coefficient for the rows (cultivars) was 0.70, and that for the columns (SNPs) was 0.71.

