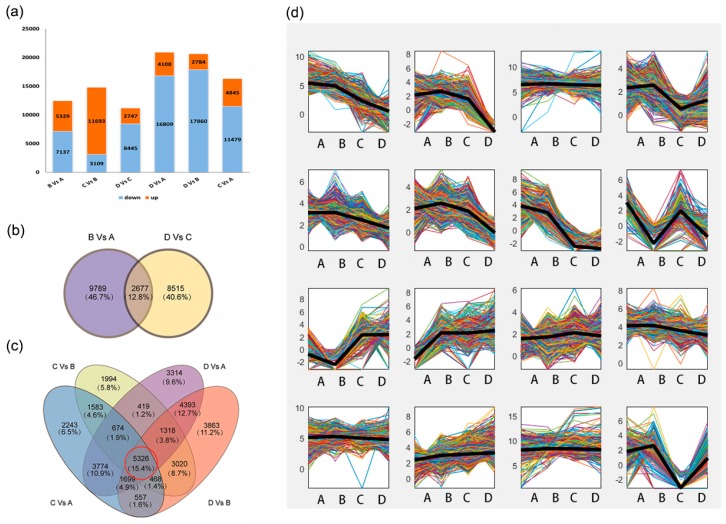
Figure 2.
Distribution of DEGs among different development stages in C. oleifera seed and clustering of global gene expression. (a) The number of up- and down-regulated DEGs between Stages; (b) a Venn diagram of DEGs of Stage B-A and Stage C-D; (c) a Venn diagram of DEGs of Stage C-A, Stage C-B, Stage D-A and Stage D-B; the red circle indicates the common DEGs; (d) clusters of the expressed genes obtained by K-means clustering.

