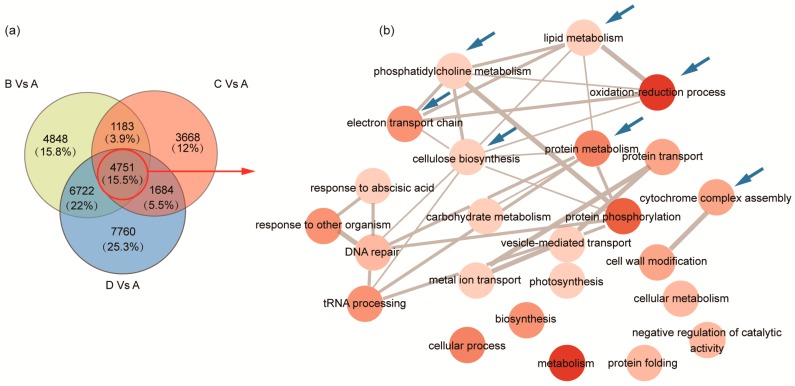
Figure 3.
GO enrichment analysis of common DEGs. (a) A Venn diagram of DEGs in Stage B-A, Stage C-A and Stage D-A; the red circle indicates the common DEGs in Stage B-A, Stage C-A and Stage D-A; (b) common unigenes (4751) were used for GO enrichment analysis and grouped by ReviGO. The darker the red color indicates a smaller FDR-corrected p-value. Blue arrows indicate relevant biological process of lipid metabolism and their direct connections.

