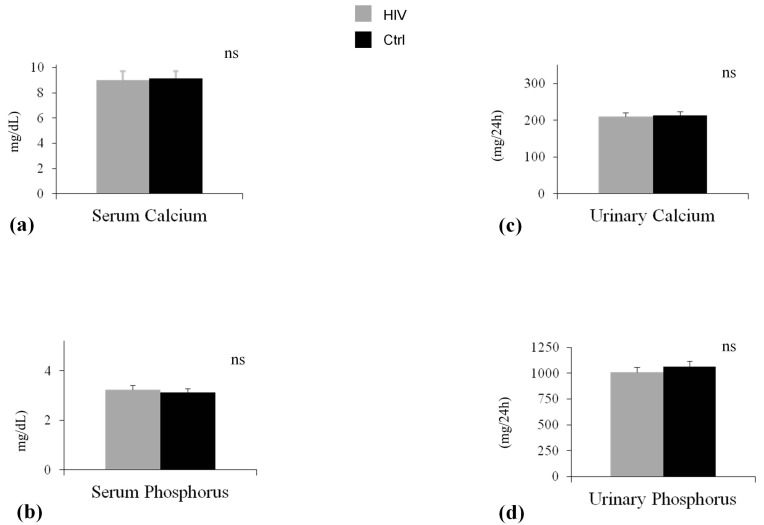
Figure 2.
Serum and 24 hours urinary escretion of Calcium and Phosphorus in two groups. Data are expressed as means and SD. (a) The baseline differences of Serum Calcium between HIV group (HIV) and control group (Ctrl) was not statistically significant (p = 0.13); (b) The baseline differences of serum Phosphrous between HIV group (HIV) and control group (Ctrl) was not statistically significant (p = 0.67); (c) The baseline differences of urinary Calcium between HIV group (HIV) and control group (Ctrl) was not statistically significant (p = 0.82); (d) The baseline differences of urinary Phosphrous between HIV group (HIV) and control group (Ctrl) was not statistically significant (p = 0.31).

