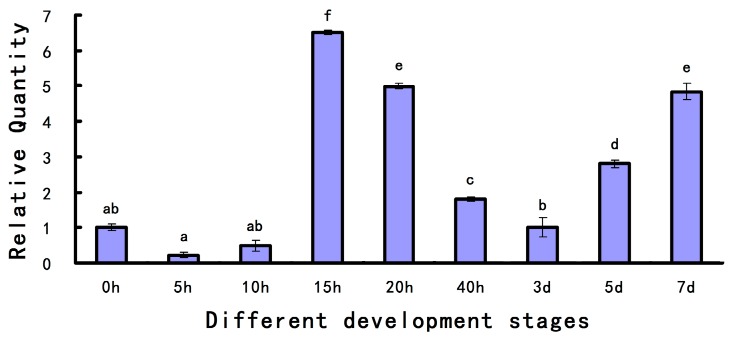
Figure 4.
Quantitative real-time PCR (qPCR) analysis of As-pdrg1 expression during different developmental stages of A. sinica. The messenger RNA (mRNA) expression levels of As-pdrg1 and β-actin were measured at various time points during development, and data are presented as means ± SD of triplicate experiments. The development stage at 0 h was set as the control group. The x-axis indicates the developmental stage (0 h–7 days); and the y-axis indicates the expression level relative to expression at 0 h. Significant differences between developmental stages (p < 0.05) were analyzed by one-way analysis of variance (ANOVA) and are indicated with letters (a–f).

