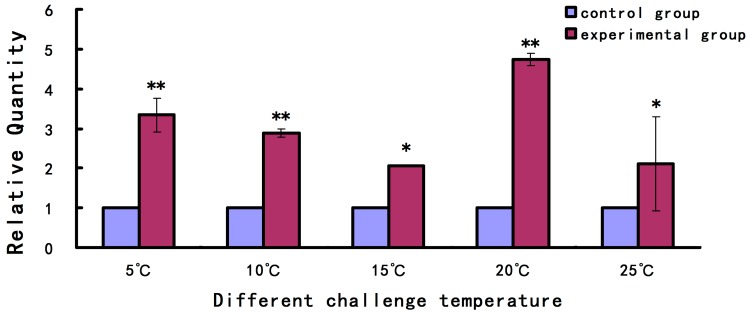
Figure 5.
Quantitative real-time PCR (qPCR) analysis of As-pdrg1 expression in response to temperature stress. The mRNA expression levels of As-pdrg1 were measured after challenge with five different temperature concentrations. The 30 °C treatment condition served as the control. Data are presented as the means ± SD of triplicate experiments. Highly significant differences between the experimental and control groups are indicated with ** p < 0.01, while significant difference are indicated with * 0.01 < p < 0.05.

