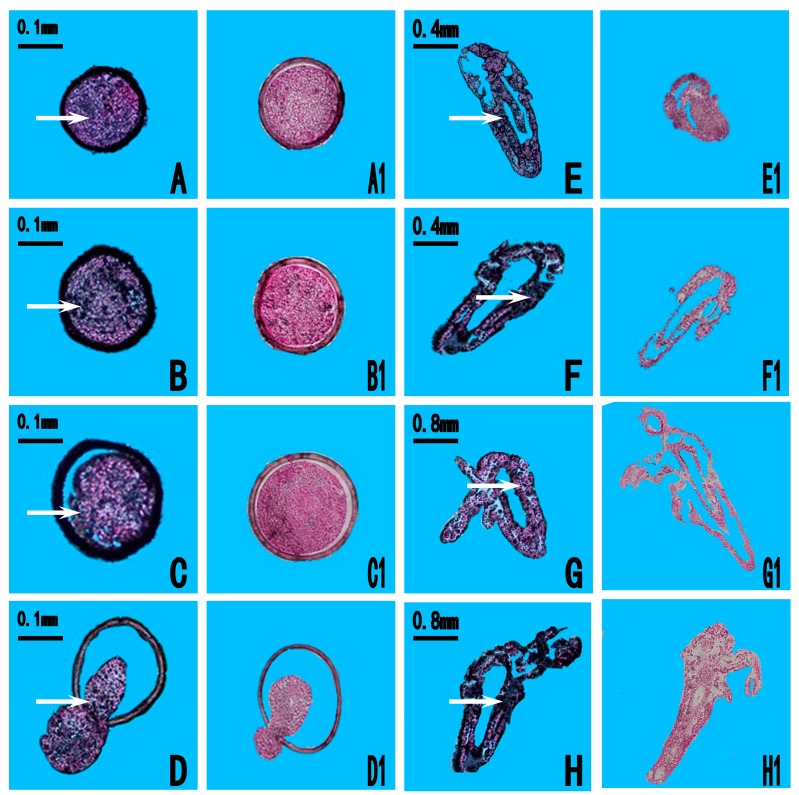
Figure 6.
In situ hybridization analysis of As-pdrg1 expression during different developmental stages of Artemia sinica. (A–H) experimental groups, (A1–H1) control groups. (A) 0 h, gastrula stage of Artemia cysts; (B–D) 5 h, 10 h and 15 h, embryonic stage; (E,F) 20 h and 40 h, nauplius stage; (G) 3 days, metanauplius larva stage; (H) 5 days metanauplius stage. Arrows indicate positive signal regions.

