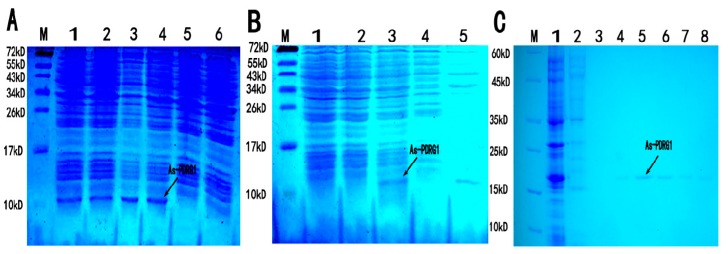
Figure 7.
(A) Expression of As-PDRG1 recombinant protein. M: Protein markers from 10 to 72 kDa. Lanes 1–4 show the expression of the As-PDRG1 recombinant protein from four induction treatments. (1 mM isopropyl β-d-1-thiogalactopyranoside (IPTG) at 37 °C, 1 mM IPTG at 30 °C, 0.25 mM IPTG at 37 °C, and 0.25 mM IPTG at 30 °C, respectively). The arrow shows the position of the expressed recombinant protein. Lane 5: Total proteins from non-induced cells. Lane 6: Total proteins from induced cells harboring vector pET-30a (control). (B) Detection of soluble As-PDRG1 recombinant protein (control). Lane 1: Total proteins from uninduced cells. Lane 2: Total proteins from induced cells harboring vector pET-30a (control). Lane 3: Total As-PDRG1 recombinant protein. Lane 4: Soluble fraction of the lysate from induced cells harboring pET-30a-PDRG1. Lane 5: insoluble fraction of the lysate from induced cells harboring pET-30a-PDRG1. (C) Purification of recombinant As-PDRG1 protein. M: Protein markers from 10 to 60 kDa. Lane 1: Unpurified, induced As-PDRG1 recombinant protein. Lane 2: Flow-through eluate of total proteins. Lanes 3–8: Column elution with elutant containing 5 mM, 10 mM, 20 mM, 40 mM, 60 mM and 80 mM imidazole, respectively.

