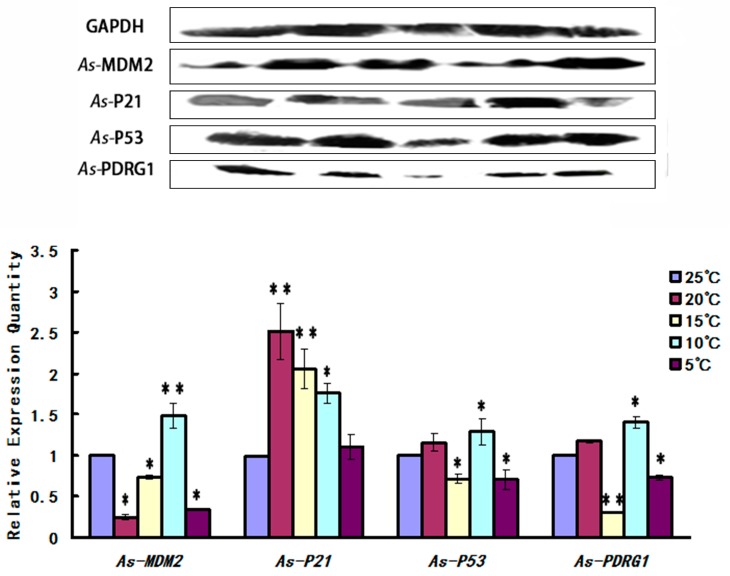
Figure 9.
Western blot showing the abundances of As-MDM2, As-P21, As-P53, and As-PDRG1 proteins in response to temperature stress in A. sinica. The band intensities of these proteins were normalized against that of GAPDH. Expressions of the proteins at 25 °C served as the control. Statistically significant differences are indicated with ** p < 0.01, while * represents 0.01 < p < 0.05.

