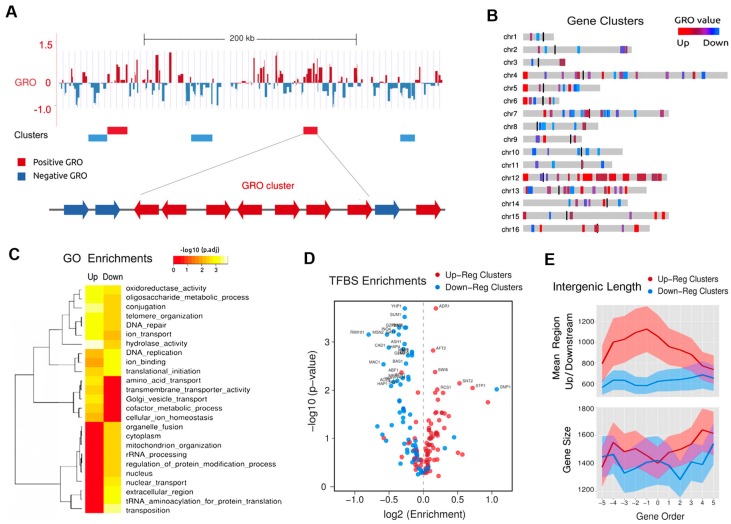
Figure 3.
Functional enrichment and regulatory modes of non-random topologically co-regulated clusters. (A) Top: example of individual gene genomic transcription run-on (GRO) values and their location in a section of chromosome IV. Red represents increased gene expression (positive) and blue presents decreased (negative). Bottom, cluster definition as a number of contiguous genes with similar GRO values; (B) Chromosomal distribution of 116 topologically co-regulated gene clusters (TCGCs). (C) GO term enrichment of up and down regulated TCGCs; (D) Enrichments of transcription factor binding sequences (TFBS) for 102 yeast transcription factors; (E) Top: mean intergenic region length for clusters of 11 consecutive genes. Bottom: same analysis for mean gene length. Shaded bands are 95% confidence intervals. Graphs (A–E) reproduce a summary of the analyses reported by Tsochatzidou et al. [39].

