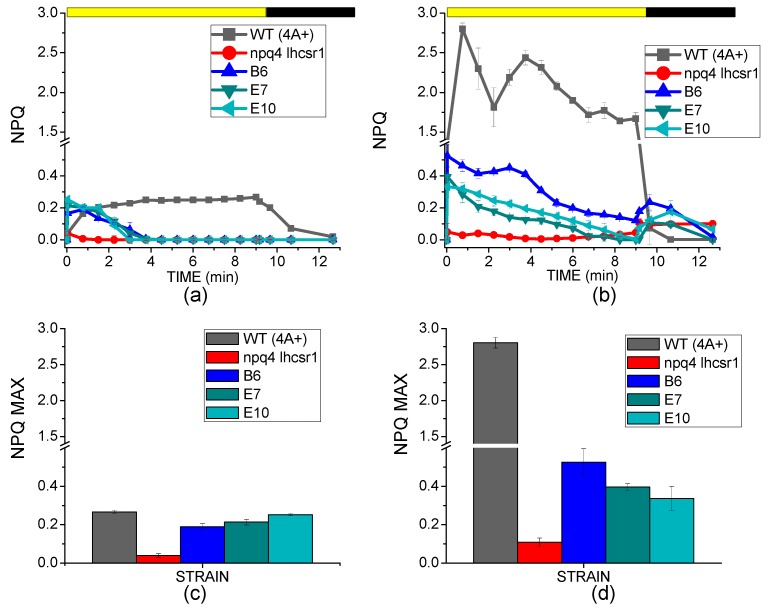
Figure 3.
NPQ kinetics and NPQ maximum induction. (a,b): NPQ kinetics measured in cells grown in low light (a) or high light (b) upon actinic light illumination (1200 μmol m−2·s−1), and dark recovery. Yellow bar indicates the illumination period and the dark bar indicates the dark recovery; (c,d): maximum NPQ values detected for WT, transformed lines and their background npq4 lhcsr1 grown in low light (c) or high light (d) with standard deviation reported as error bar (n = 3).

