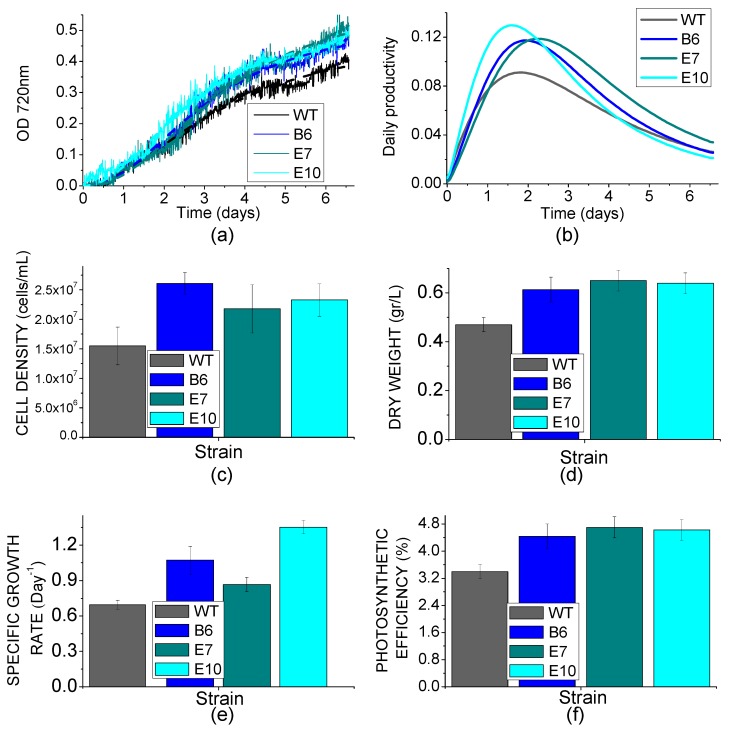
Figure 8.
Biomass productivity in photobioreactors. (a): growth curves of WT and transformed lines obtained by measuring the optical density (O.D.) at 730 nm.. Growth curves were fitted with an exponential growth function; (b): daily productivity estimated from the first derivate of the fitting curves reported in (a); (c): cell density obtained at the end of the growth curve; (d): dry weight obtained at the end of the growth curve; (e): specific growth rate (μ) for WT and transformed lines; (f): photosynthetic efficiency of WT and transformed lines calculated from dry weight obtained at the end of growth curve. Mean value of three independent measurements are reported. Standard deviation are reported as error bars (n = 3).

