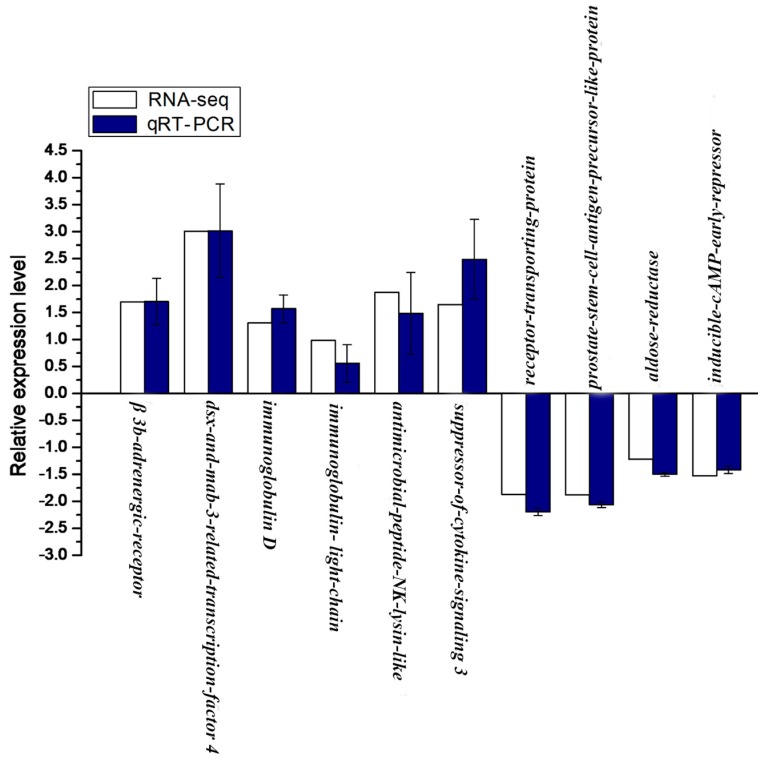
Figure 7.
Validation of RNA-seq data by qRT-PCR. Y-axis, the relative expression level was expressed as log2 (fold change) in gene expression; X-axis, gene name. The relative expression of 10 genes, were detected by RT-qPCR (blue column) and compared with the results of RNA-seq (white column). Error bars represented standard deviation (SD).

