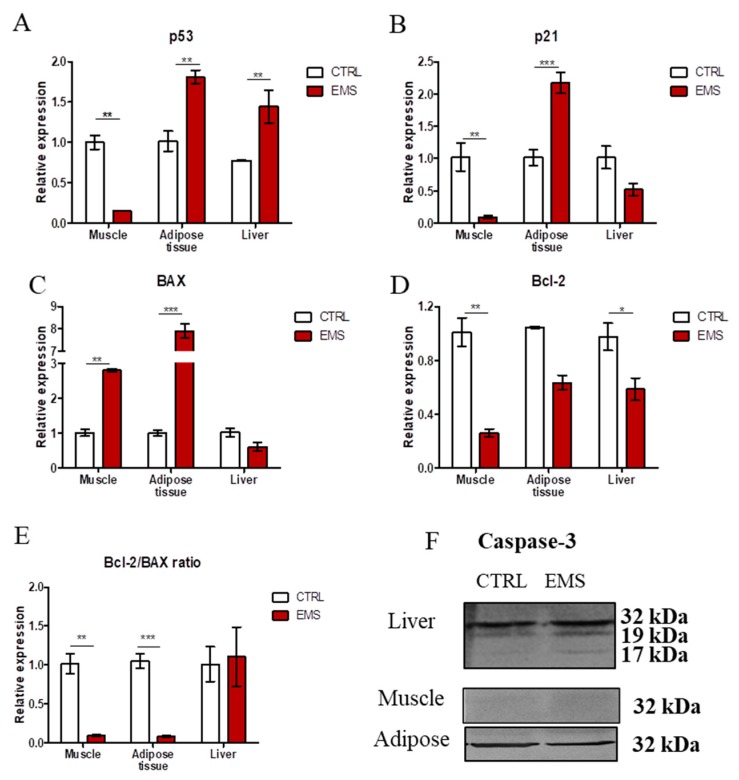
Figure 3.
Evaluation of apoptosis in muscle, adipose tissue and liver of healthy (CTRL) and EMS individuals. Using RT-PCR, we evaluated the expression of p53 (A), p21 (B), BAX (C), Bcl-2 (D) and the Bcl-2/BAX ratio (E). Moreover, the amount of caspase-3 in samples was established by Western blot analysis (F). Results expressed as the mean ± S.D. * p < 0.05, ** p < 0.01, *** p < 0.001.

