Figure 5.
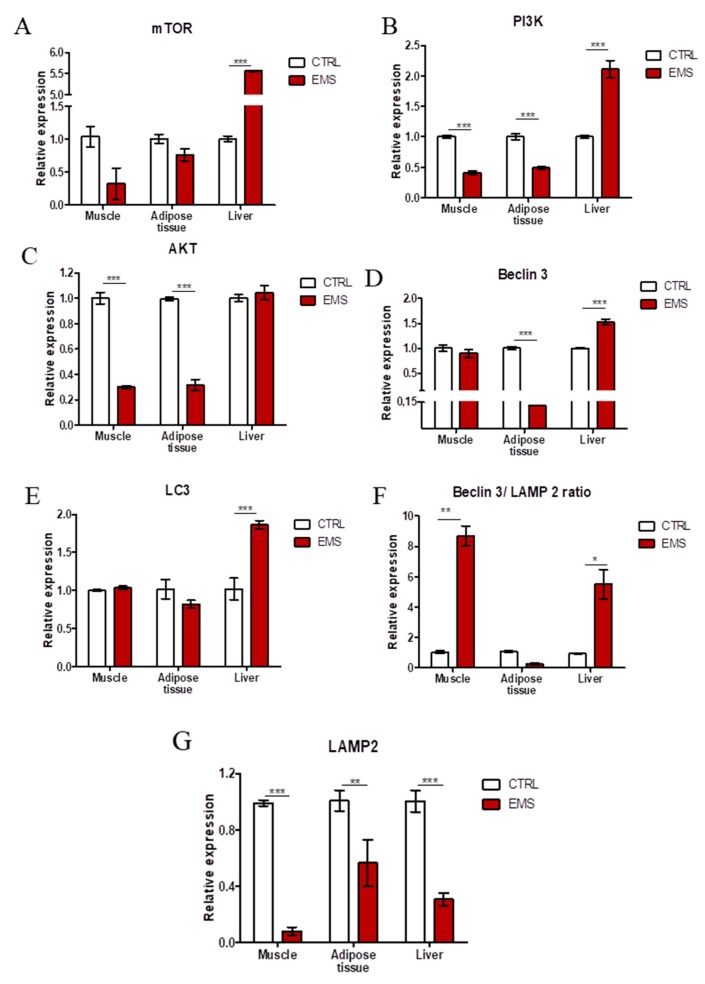
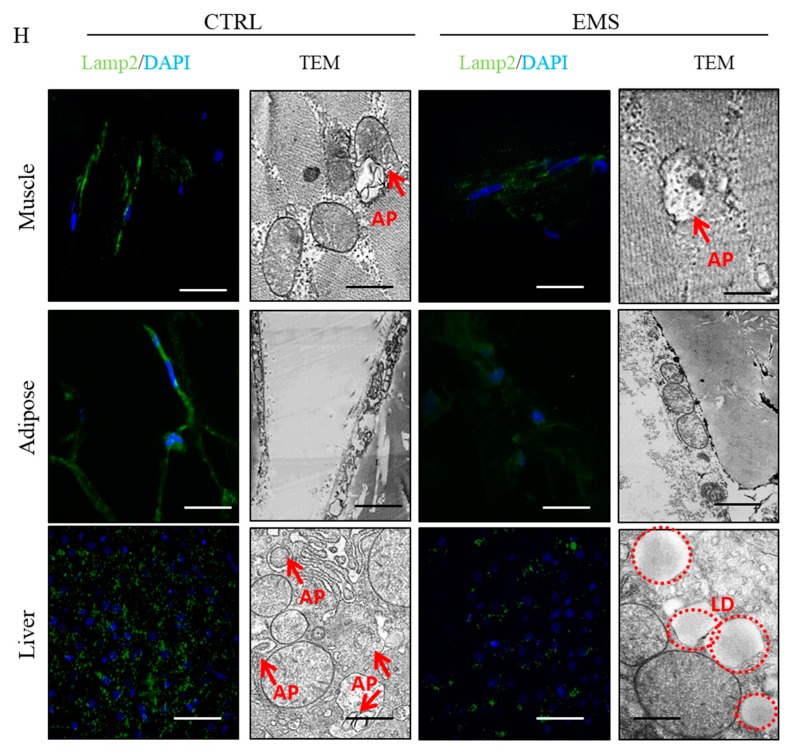
Evaluation of autophagy in muscle, adipose tissue and liver from healthy and EMS individuals. Using RT-PCR, the expression of mTOR (A), PI3K (B), AKT (C), Beclin-3 (D), LC3 (E), the ratio of Beclin/LAMP2 (F) and LAMP2 (G) was investigated. Using immunofluorescence, intracellular localization of LAMP2 in samples was examined (H). TEM analysis allowed for visualization of autophagosomes’ formation (indicated with red arrows (I)). LD, lipid droplets; AP, autophagosomes. Results expressed as the mean ± S.D. * p < 0.05, ** p < 0.01, *** p < 0.001. Scale bars: confocal 20 µm, transmission electron microscope (TEM) 200 nm.


